
A code pattern for Datadog logging
A simple pattern to help reduce the risk of accidentally breaking external dependencies

DataDog is a great tool for monitoring your services. By deploying your application with an agent your logs can be published to Datadog - after which you can view, search and monitor your logs through the Datadog web application.
The first thing to do is get your application logging in JSON format. This is needed so any multi-line log statements are recognised as one event, not many events (stack traces etc)
Once the agent is configured and running, you’ll be able to see your logs in Datadog - similar to the screen shot below:
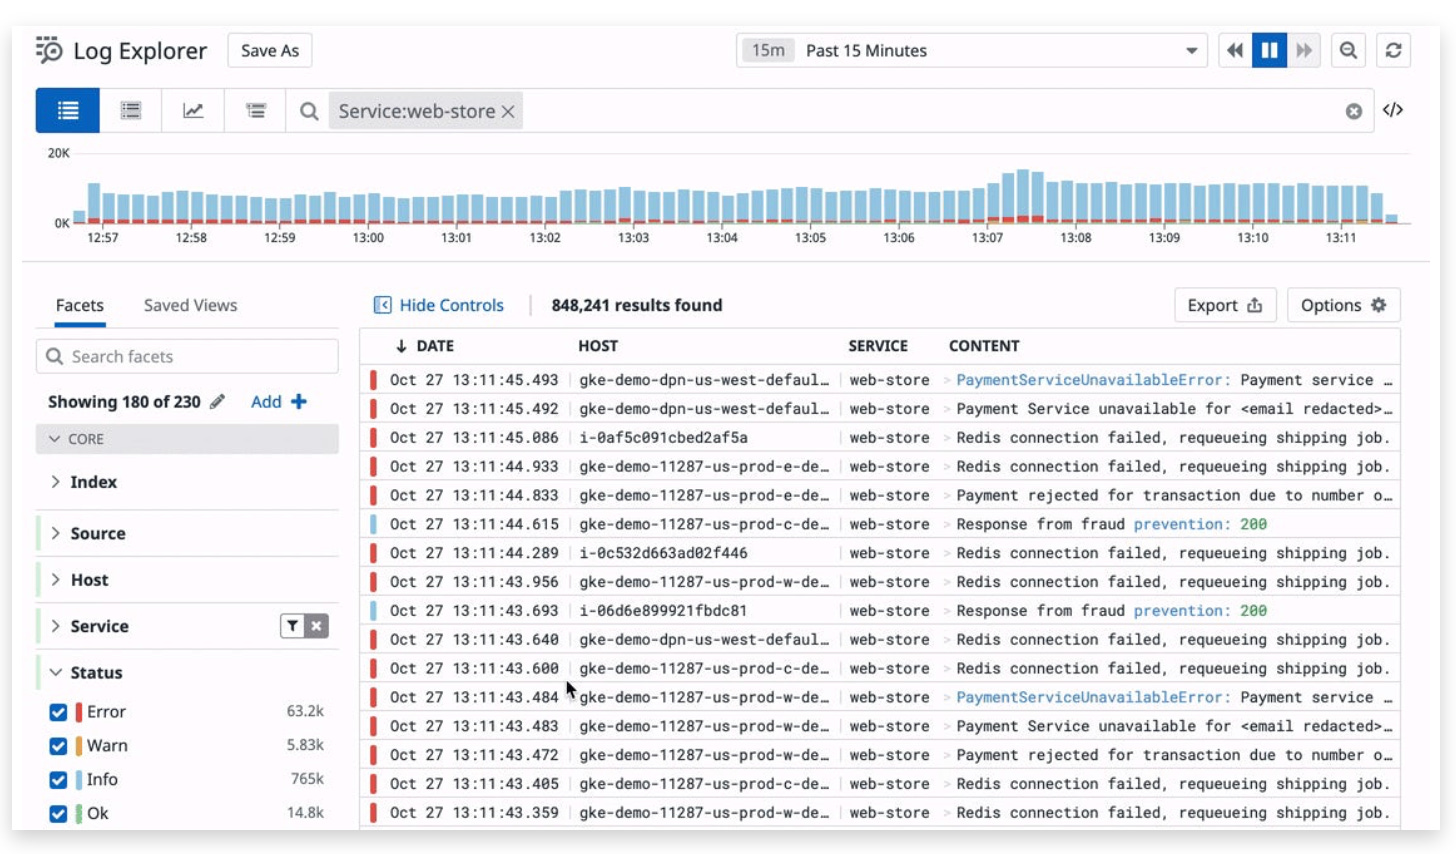
When configured correctly, Datadog will be able to parse the log entries so you can filter and search by host, environment, service, log level (error, warn, info etc), MDC variables etc.
If you aren’t using the logging MDC in your application yet, it’s worth looking into - you can provide contextual information to all of the log messages in a thread easily - the simplest example might be that you can add a user identifier to the MDC in your REST controller so that all log statements for the duration of that request contain the user id. Add any other contextual information that helps improve the monitoring your application.
You can also set up monitors based on log entries - and then notifications based off these monitors - so for example you could receive a slack notification when the count of errors in your application exceeds a threshold.
In some cases monitors will be set up based on the content of a log message. Let’s say we have some code that looks like this:
// something something
logger.warn("I'm Givin' Her All She's Got, Captain!")
// something something
Now we can set up a monitor to count log occurrences containing `I'm Givin' Her All She's Got` and we can then configure it to send a slack message if it exceeds a threshold…
But what happens if someone comes along and makes a change to that message - without realising that an external monitor is using that exact phrase? (maybe they don’t like your Star Trek references…)
We could add a comment to warn them:
// something something
// this is used by a Datadog monitor, please don't change
// <link to monitor goes here>
logger.warn("I'm Givin' Her All She's Got, Captain!")
// something something
But we can probably do better than that. One problem is that we can’t easily/reliably find occurrences of this across the code base - “Find Usages” is one of the best IDE capabilities for navigating code bases and it would be nice to be able to use it in this use case.
In order to make it more robust, we could introduce CODES instead of arbitrary strings - there would never be a reason to change a code, so we can set it and forget it, and use it (and only the code) in the monitor definition.
And what better way to define a code than an enum?
enum class LogEvent(val description: String) {
    LE001("I'm Givin' Her All She's Got"),
    LE002("Live Long and Prosper"),
    LE003("Make It So");

    override fun toString(): String {
        return "$name/$description: "
    }
}
In this case I’ve given the enum a description so the log message can be self contained - you don’t need to go look up the enum to find out what the code means.
Now it can be used as follows:
logger.warn { "${LogEvent.LE001} and any other information goes here" }This will result in a log entry that looks something like (depends on your logger configuration)
14:55:54.172 [main] WARN c.e.d.app.LoggerExample MDC= - LE001/I'm Givin' Her All She's Got: and any other information goes hereAnd the monitor in Datadog can now reference “LE001” - a code that should never change.
It’s at this point that the code becomes slightly more self-describing - people working with this codebase can now look at the LogEvent enum to see what significant events might occur, and use “Find Usages” to navigate to those places.
There is one more thing that we might consider - if someone were to change the logging level for a package in the logger configuration, they might risk turning off these log messages - the logger used in the above example is the logger associated with the class that wants to emit the log statement!
A simple change can reduce this risk - we can define a central class that is responsible for emitting these log messages, and update the logging configuration with a commented statement to set the logging level for this class:
object LogMgr {
    private val logger = KotlinLogging.logger {}

    fun log(event: LogEvent, msg: () -> kotlin.Any?) {
        logger.info { "$event - ${msg()}" }
    }
}
We can use it like this:
LogMgr.log(LogEvent.LE001) { "and any other information goes here ${LocalDateTime.now()}" }And in the logging configuration we can ensure LogMgr is enabled:
<!--
LogMgr is used to emit logs that are referenced by external systems eg log monitoring and notification.
Do not disable this class.
-->
<logger name="com.example.dataprocessingexperiment.app.LogMgr" level="TRACE" />
Summary
Important messages are enumerated in LogEvent
Calls to log important messages used by external systems are centralised into LogMgr
IDE “Find usages” allows us to find where these important events happen
This somewhat increases the “self-documenting” aspect of the system
Chance of unknowingly breaking monitoring is slightly reduced.
What do you think? Does it improve the codebase or just convolute it unnecessarily?
Note: Datadog monitors can be defined via Terraform and allows you to implement monitoring as code - beside the obvious benefits, this has the added bonus of being able to search your codebase for the logging code (eg “LE001”) to find where it is used - eg it will expose the monitor configuration easily.
Datadog only gives you a short free trial to try the product out. It’d be great if you could just use it free with small quotas, but no - So unfortunately it’s not useful for small side projects. There are other options - one I know of is Papertrail.